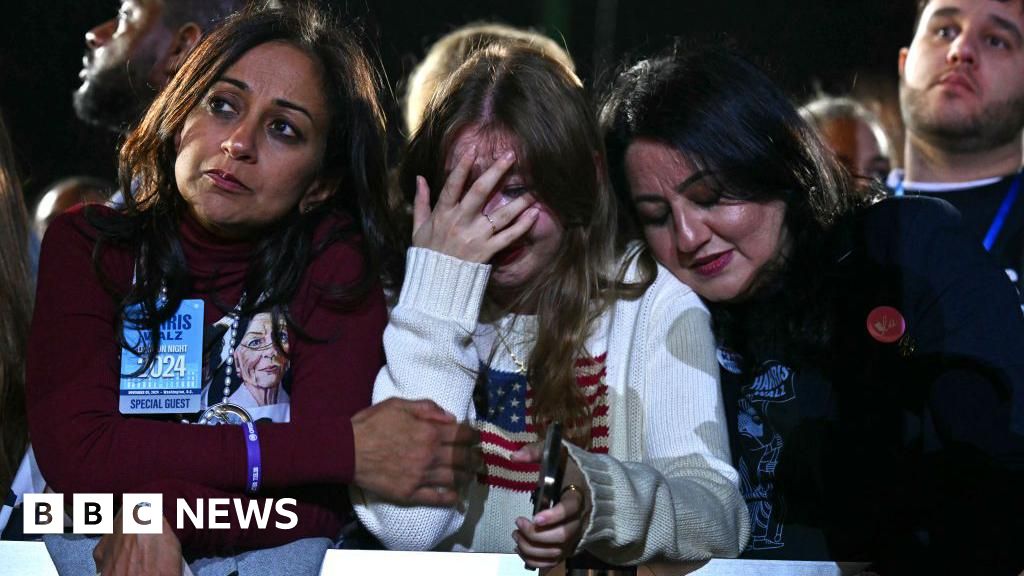
 Getty Images
Donald Trump has won the presidency of the United States, gaining a historic second term.
Votes are still being counted, but a picture is emerging of what tipped the balance in Trump’s favour: relatively small shifts in support in many different places.
The map below shows in red the states where Trump won. Kamala Harris’s victories are shown in blue.
Margins of victory
The swing towards Trump happened across the country, as shown in the county level map below, although counting continues in many states especially in the west.
Harris led by tens of thousands of votes in major cities.
But Trump dominated the rural counties that lie between them. His wins may not appear to be as sizeable, but they are pervasive. And those margins add up.

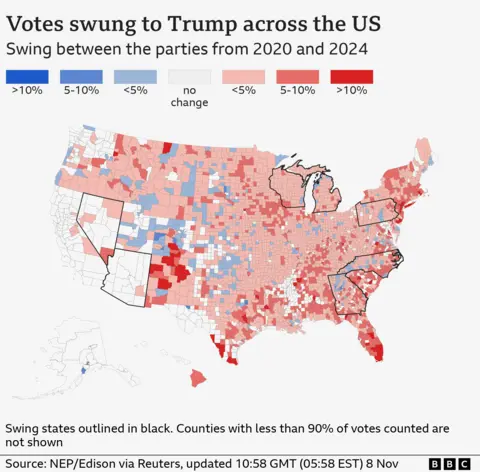
In 2020, Joe Biden turned many of Pennsylvania's counties Democrat blue - particularly those near the eastern city of Philadelphia. In 2024, voters seem to have reversed their positions as more votes in the eastern parts of the state went to Trump.
Around Georgia’s major metropolis of Atlanta, votes for Harris were higher than for Biden. But almost everywhere else went further red, the colour of the Republican party, and this picture could become clearer as more votes are tallied.
In Wisconsin, Trump won by less than one percentage point - just over 28,000 votes at latest count.

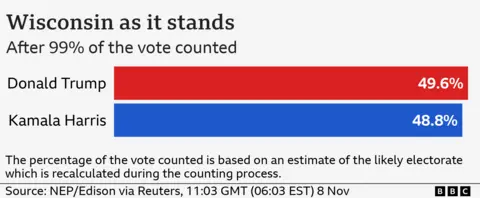
It is difficult to identify a single group or area in the state that moved the needle towards Trump.
His share of the vote increased by less than 5% in all but a handful of counties across the state, compared with 2020.
If you look at the map below the change is almost imperceptible.

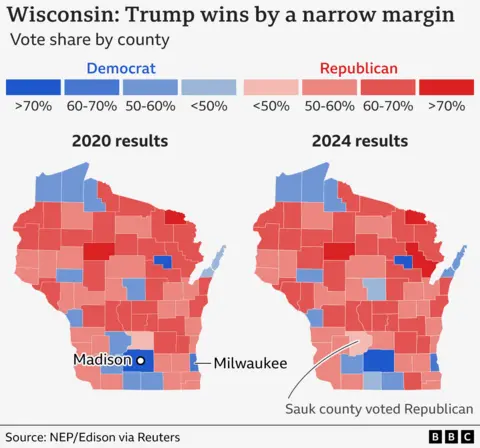
Harris did well in the traditional Democratic urban strongholds of Milwaukee and Madison; voters came out for her in large numbers.
Yet it was Trump’s small but widespread gains in counties across the state that did the trick.
Trump gains with Hispanic Nevadans
Trump has taken Nevada, the first Republican win in the western battleground since 2004.
In the vote tally so far, there has been little change among the largest groups of voters.
Black voters chose Harris in similar numbers as they did Biden, while white voters maintained their support for Trump.
Yet the exit poll suggested Trump saw a substantial increase in support among Hispanic and Asian voters, with Harris losing ground compared with Biden four years ago.
Trump raised his share among Hispanic voters in Nevada by 13 points compared with 2020, which meant he and Harris ended up in a tie, both securing 48% of that vote.

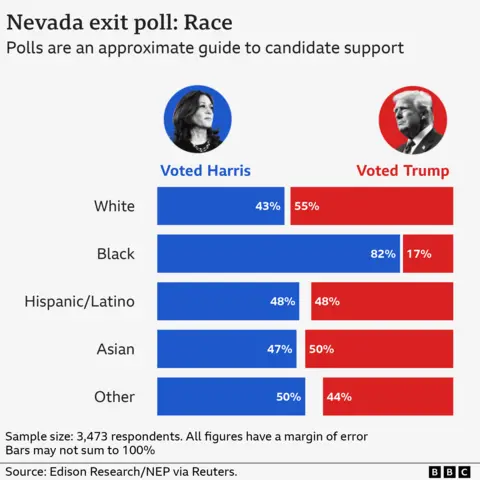
He also enjoyed a very substantial swing among Nevada’s Asian voters, from 35% in 2020 to 50% in 2024.
While the Asian community accounts for just 4% of voters surveyed, we’ve seen how similarly small shifts made the difference elsewhere.
People voted for change
While the picture in the states that flipped will become clearer in the coming days, we can see some emerging trends on how different groups of people voted across the nation from US exit polls.
These cut across demographic groups and regions.
On immigration and the economy, Trump was seen as the overwhelming favourite among voters for whom either was the most important issue.

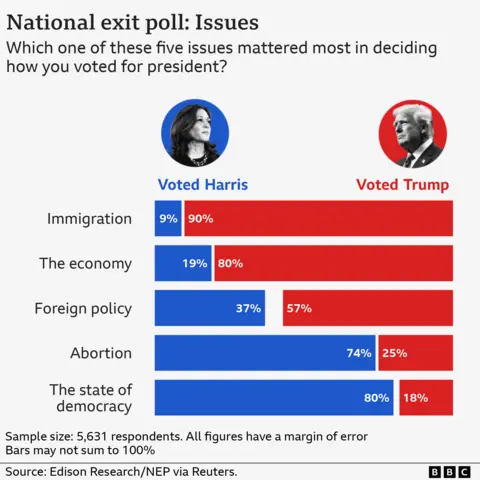
For voters who felt strongly about abortion or the state of democracy, three-quarters or more voted for Harris.
This suggests a stark difference in priorities across the two groups of voters.
Both campaigns emphasised these diverging issues in recent weeks, and it’s clear the messaging cut through.
The personalities of the candidates themselves may also have played a role in how ballots were cast.
For those looking for a presidential candidate who would “bring needed change” to the country, a large majority voted for Trump. And two-thirds of those who most valued leadership skills did the same.

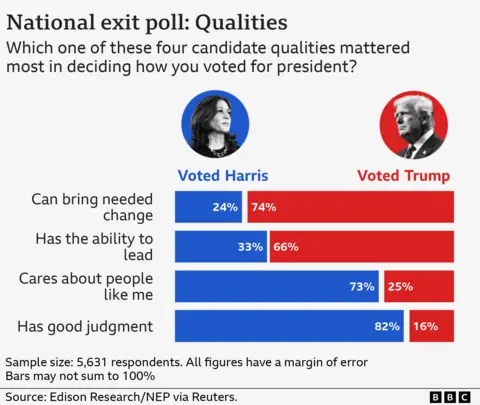
A large majority of Harris voters chose her because they felt she had good judgement and “cared about people like me”.
But the desire for change can be a powerful force when it comes to the way voters choose to cast their ballot.
Produced by Wesley Stephenson, Becky Dale, Christine Jeavans, Libby Rogers, Alison Benjamin, Zak Datson, Muskeen Liddar, Erwan Rivault, John Walton, Callum Thomson, Rob England, Phil Leake, Daniel Wainwright

 3 hours ago
3


